The following graphs are adapted from Knee Ligaments: Structure, Function, Injury, and Repair, Dale M. Daniel, Wayne H. Akeson, John J. O’Connor (ed.), 1990, Raven Press, New York, NY. Figures 24-11 and 24-13.
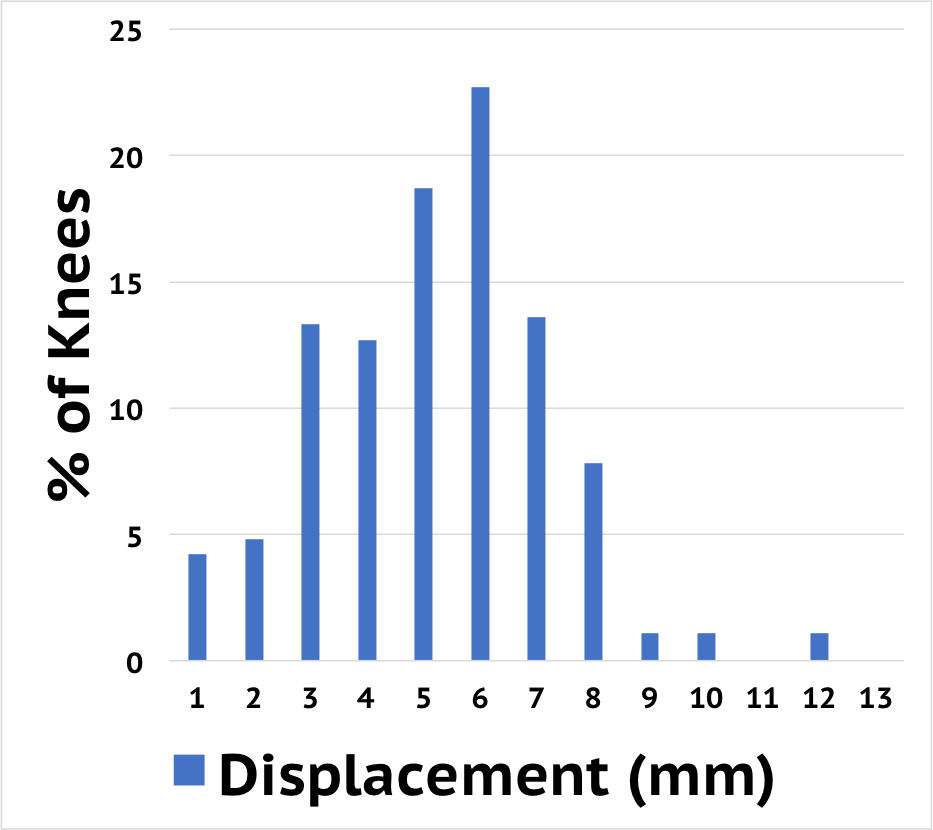
Normal Knee
The graph at left represents distribution of the normal knee as measured by the Medmetric KT knee arthrometer.
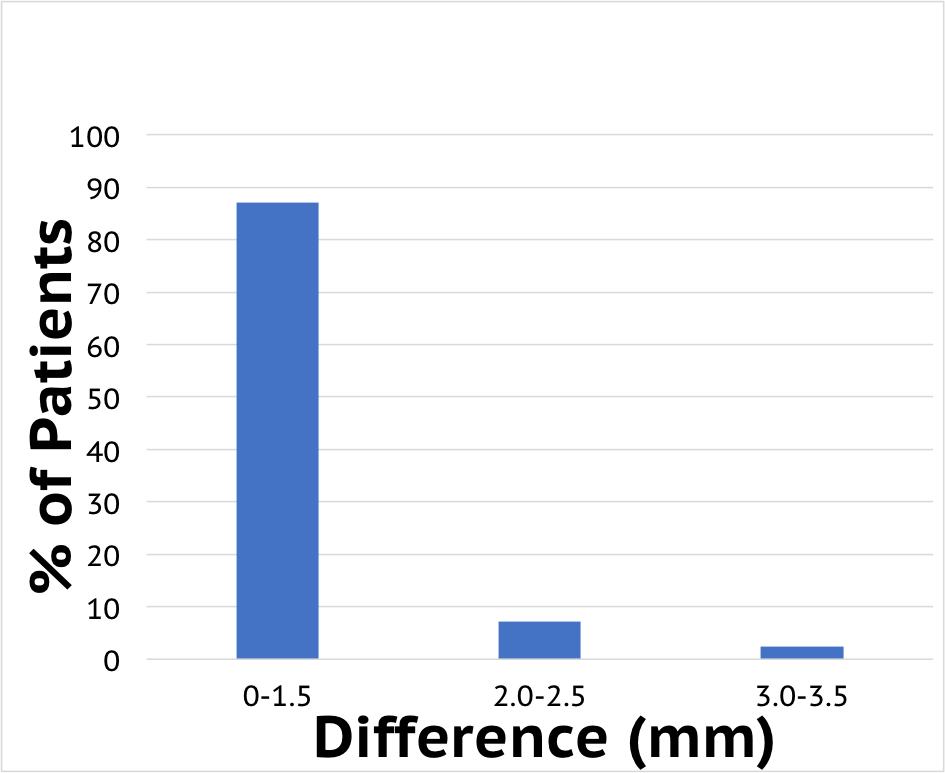
Right and Left Knee Compared
In the graph at the right, the difference between the right and left knee of the same patient is mesured with the KT knee arthrometer. Notice that the difference between the right and left (non-injured) knee is minimal (<1.5 mm).
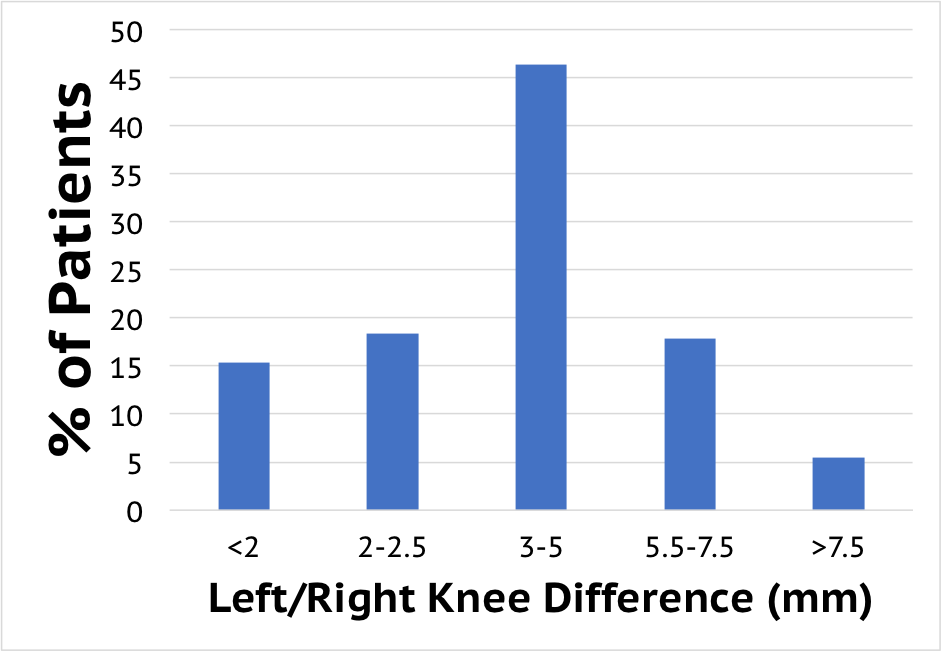
ACL Injured vs Non-Injured
The graph at left represents the difference in laxity between the ACL deficient knee and contralateral knee as measured by the KT knee arthrometer. These results show that ACL injury can be demonstrated by a laxity difference of > 3 mm between and ACL injured and non-injured knee.